Why do my MAS 5.0 values differ?
What am I talking about?
I am talking about the MAS values that you might get when using the Bioconductor package affy. In particular comparing these values with those from Affymetrix MAS software. Please note that this document refers to results from version 1.2.7 of affy, but should apply to all later versions. The results may not hold true for older versions of the affy package ie the Bioconductor 1.1 release.How were the MAS methods implemented in affy?
The methods were implemented based upon available documentation. In particular a useful reference is Statistical Algorithms Description Document by Affymetrix. Our implementation is based on what is written in the documentation and as you might appreciate there are places where the documentation is less than clear.All source code of our implementation is available. You are free to read it and suggest fixes.
Using public data to compare implementations
I will use data from 30 liver arrays from the Genelogic dilution study which may be obtained here. I will ignore normalization and just look at unscaled expression values.Computing MAS numbers using "affy"
The expression values were computed using the expresso command. This document refers to results from version 1.2.7 of affy, but other versions should behave similarly. The exact command used wasComparing values
First make an M vs A plot comparing the MAS values from "affy" we will refer to this as values from E* to the MAS values from Affymetrix we will refer to these as values from A*. Such a plot is shown for 4 arrays below.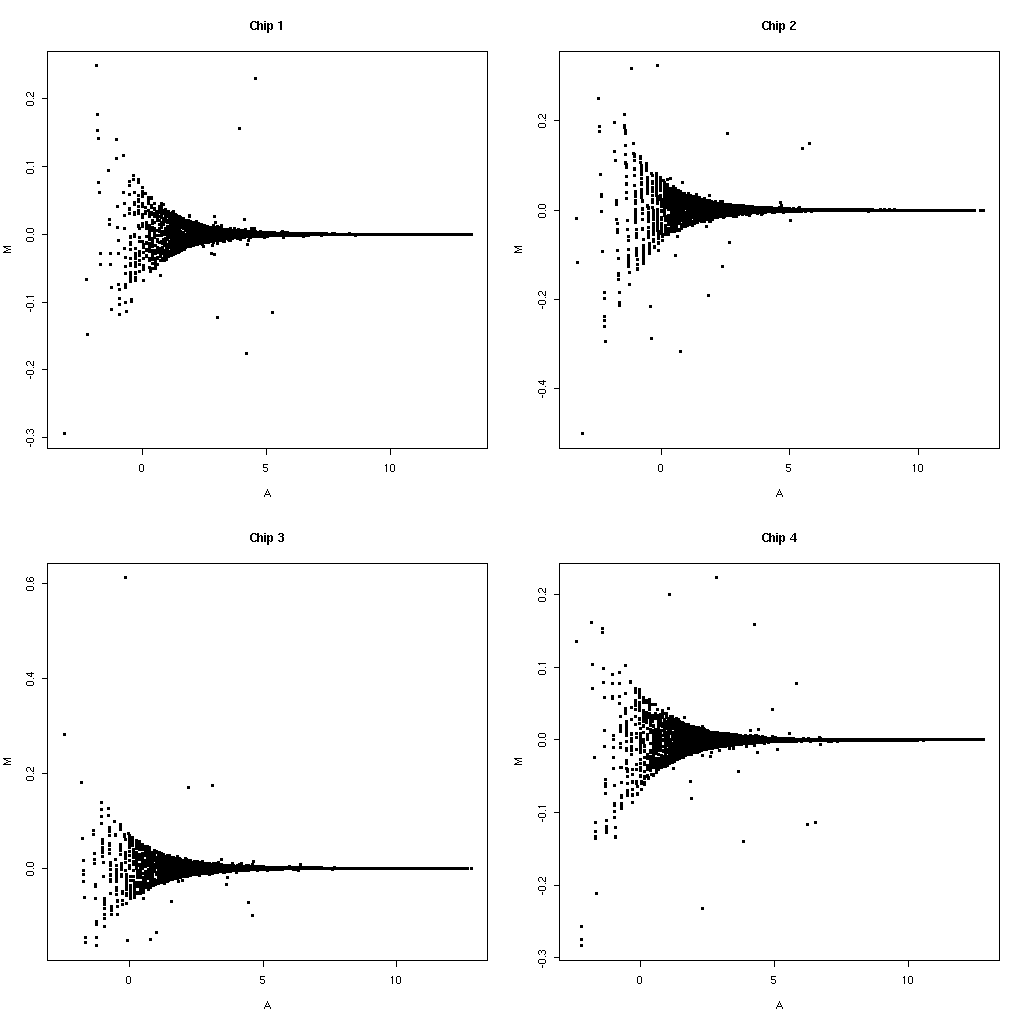
Rounding has an effect
MAS 5 values A* are typically rounded to 1 decimal place. Applying this same rounding to our values from E* and then repeating the same plots we get much fewer disagreements. My intuition for the funnel like shapes would also be that these are also rounding issues (just at the edges of the rounding region).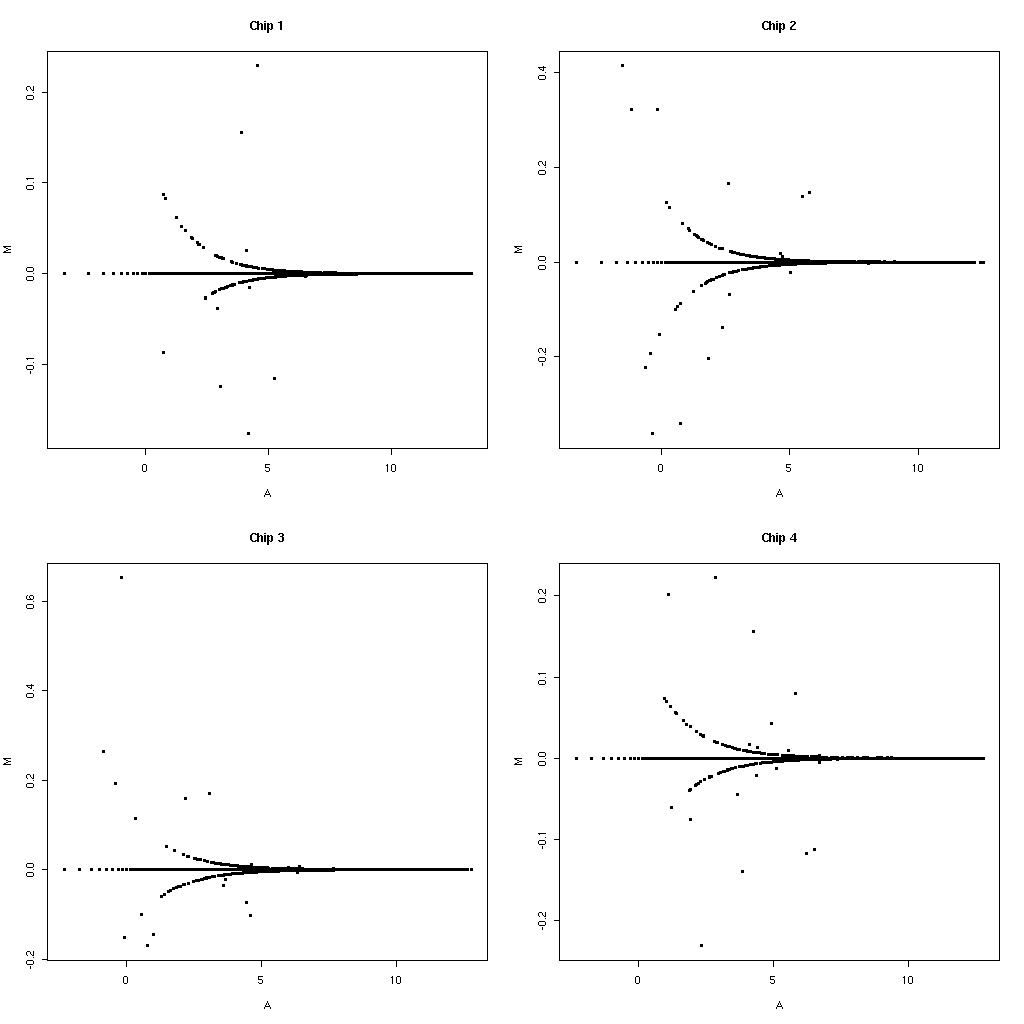
Is it the same probesets that disagree each time?
To answer the question of whether it is the same probesets that are disagreeing each time plot M values from one chip comparison against those from another. If these are the same probesets we should see points in the diagonal areas, if they are not then we will see vertical and horizontal lines.
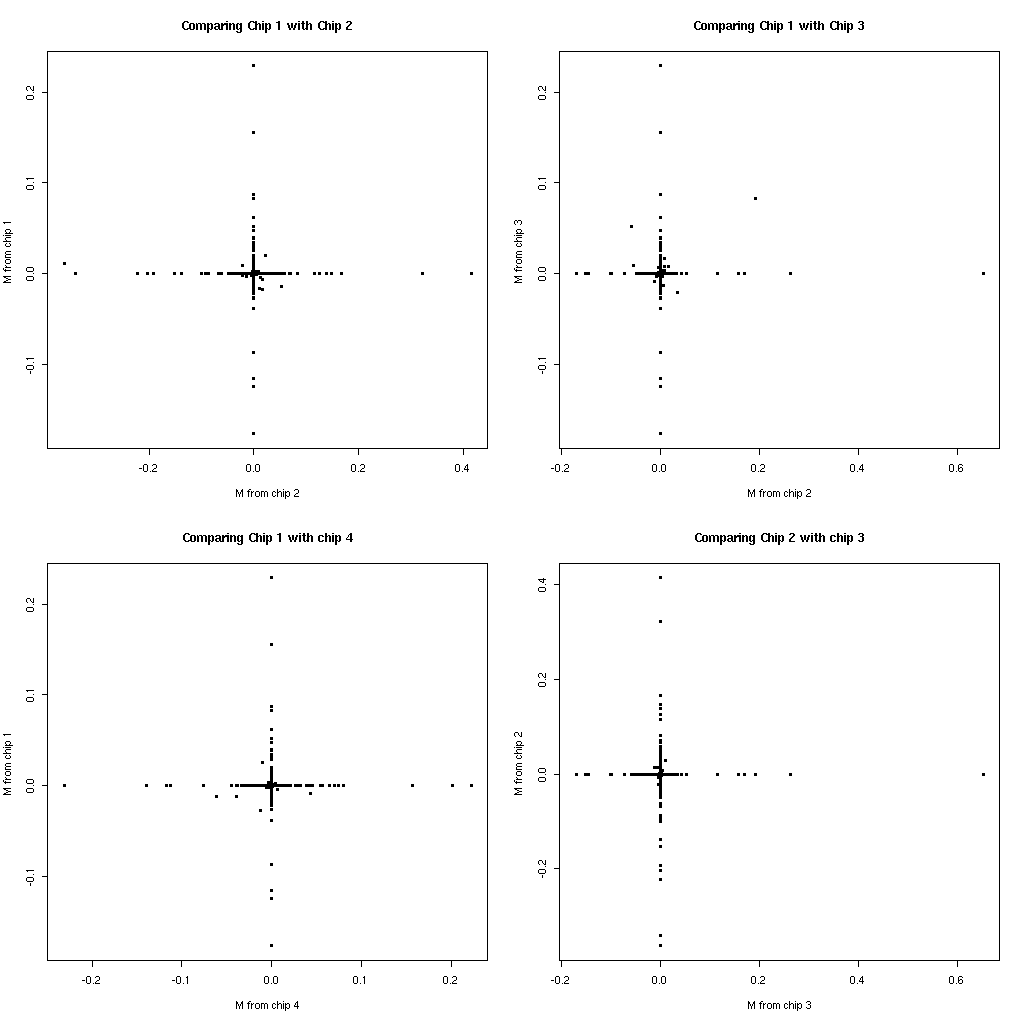
So we actually see that it is not the same probesets disagreeing each time. Possibly something magical is happening it is not yet clear.
How many probesets are disagreeing?
The table below is using the most stringent criteria to determine disagreement in column 2 and 3sum(abs(log2(Astar[,i])-log2(round(Estar[,i],1))) > 0)
and a slightly less stringent criteria for columns 4 and 5
sum(abs(log2(Astar[,i])-log2(round(Estar[,i],1))) > 0.005)
| Array | Number disagreeing (Strict) | Fraction of probesets (Strict) | Number disagreeing | Fraction of probesets |
| 1 | 452 | 0.036 | 124 | 0.010 |
| 2 | 433 | 0.034 | 196 | 0.015 |
| 3 | 432 | 0.034 | 158 | 0.013 |
| 4 | 342 | 0.027 | 127 | 0.010 |
| 5 | 432 | 0.034 | 191 | 0.015 |
| 6 | 358 | 0.028 | 138 | 0.010 |
| 7 | 470 | 0.037 | 217 | 0.017 |
| 8 | 294 | 0.023 | 139 | 0.011 |
| 9 | 214 | 0.017 | 98 | 0.008 |
| 10 | 450 | 0.036 | 259 | 0.020 |
| 11 | 509 | 0.040 | 214 | 0.017 |
| 12 | 362 | 0.028 | 187 | 0.015 |
| 13 | 179 | 0.014 | 87 | 0.007 |
| 14 | 267 | 0.021 | 133 | 0.010 |
| 15 | 425 | 0.034 | 283 | 0.022 |
| 16 | 394 | 0.031 | 210 | 0.017 |
| 17 | 234 | 0.019 | 151 | 0.012 |
| 18 | 231 | 0.017 | 112 | 0.009 |
| 19 | 220 | 0.018 | 134 | 0.011 |
| 20 | 418 | 0.033 | 283 | 0.022 |
| 21 | 240 | 0.019 | 134 | 0.011 |
| 22 | 232 | 0.018 | 167 | 0.013 |
| 23 | 238 | 0.019 | 157 | 0.012 |
| 24 | 146 | 0.012 | 103 | 0.008 |
| 25 | 249 | 0.020 | 196 | 0.015 |
| 26 | 216 | 0.017 | 164 | 0.012 |
| 27 | 168 | 0.013 | 136 | 0.011 |
| 28 | 215 | 0.017 | 162 | 0.012 |
| 29 | 201 | 0.016 | 145 | 0.011 |
| 30 | 145 | 0.011 | 133 | 0.010 |
Concluding Statements
There are differences between our implementation and that of Affymetrix. Most of the differences are small and usually only a small fraction differ in value. I think alot of these differences can also be traced back to rounding issues.Differences between implementations will likely always exist but we have seen that they are not particularly drastic.
When comparing values from A* (Affymetrix) with values from E* (affy/bioconductor) you should also keep in mind whether you are comparing normalized/unnormalised data. Also remember the possibility of mask's/Affymetrix Outliers affecting your analysis. If you look in the [MASKS] and [OUTLIERS] sections of your cel files you will be able to see how many probes may be excluded using the MAS 5.0 software. Currently "affy" does not handle excluding probes in this manner particularly well. If there is a large number of such probes, then it is likely that these will have quite a drastic effect if you exclude them from your analysis.